|
Effects of the Nibiru complex on Earth since 2003
Part I
by Rolf Kenneth Myhre
Updated: 4. June 2013.
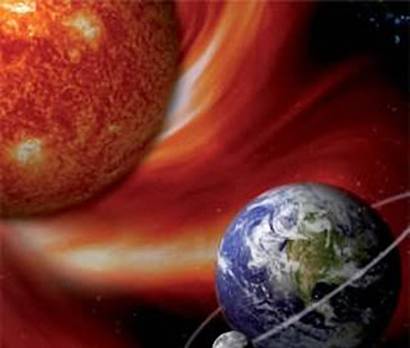
Nibiru will at its closest be 1750 X Earth's diameter from Earth
This article is part of my Nibiru trilogy:
I: History of Mankind: An integration of Velikovsky, Sitchin and ZetaTalk [Book, only in Norwegian]
II: Will Nibiru trigger an Earth crust displacement? (article)
III: Effects of the Nibiru complex on Earth since 2003 (article)
Abbreviations used in this article:
ZT: ZetaTalk
ZT Chat: A weekly newletter in Question & Answer format, where the Zetas answer questions directly.
ZT nl: A weekly newsletter which Nancy Lieder writes and edits.
Nibiru’s arrival to the inner part of our Solar system in March 2003 was picked up by seismographs all over the world (ZT note 1; ZT note 2). In this article we will take a closer look, from a ZetaTalk perspective, at what kind of effects the Nibiru complex already has had on Earth: Geoscientific and plate-tectonical, climatological and meteorological, electromagnetic and biological.
Contents
A) Effect of Nibiru: Earth’s wobble of the spin axis
A100: Earth’s tectonic plates are wrenched and shakened loose from each other and set in motion
A110: Stretch zone phenomena where rock layers are being pulled apart because the tectonic plate is being drawn in opposite directions simultaneously.
A111: Structures and buildings imploding; pipes and Internet cables breaking
A112: Bridges collapsing
A113: Sink holes
A114: Sounds from stress and adaptations in rock layers and tectonic plates, and booms from air layers clapping together
A120: Earthquakes
A130: Volcanic activity
A150: The release or increased pressure of gases and liquids in pockets between rock layers
A151: The Earth releases stinking methanethiol; the Tunguska event (1908)
A152: Released coalbed methane: mass deaths of birds and fish
A153: Exploding manholes
A154: Explosively high pressure in petroleum wells
A160: Greater tectonic adjustments
A200: Extreme weather, extreme temperatures, climate chaos
A210: Extreme temperatures (heat and cold records)
A220: Hurricanes and tornadoes
A230: Extreme hailstorms
A240: New and rare types of clouds
A260: Giant tidal bores and tidal floodings (unrelated to storms and to tsunamies caused by submarine earthquakes)
A270: Maelstroms
A400: Various economical, technological and productional consequences
A410: Catastrophic fall in global food production, and thus global food shortage
A430: Record high costs for natural disasters, according to reinsurers
A450: Failing GPS equipment
B) Effect of Nibiru: the Earth is warming up from within
According to ZetaTalk, Nibiru is the cause of a heat up of the Earth’s core. The heat moves outwards to the oceans, which results in ocean warming, which again influences the troposphere and the climate in several ways.
For C and D, go to Part II.
C) Other effects of Nibiru
C100: The Earth’s magnetic field: An increase in anomalies
C110: The biological compasses fail
C200: Anomalies in Moon’s orbit around Earth
C300: Increased frequency of congenital abnormalities and albinoism
C400: An increase in mental, immunodeficiency and infectious diseases
C500: Red aurora
D) Effects of Nibiru’s electromagnetic charged tail
D100: Meteors and fireballs
D200: Atmospheric electromagnetic disturbances
D210: Satellites rotating out of position or crashing towards Earth out of control
D220: Massive power blackouts worldwide
D230: Train and aviation accidents due to sudden failure in the electrical signal system
D240: ”Star jelly & Angel Hair” in the air, and ”white milky fluid” in the water
D300: Hydrocarbon phenomena: Light towers, neon clouds, spirals
D400: Carbohydrate phenomena: ”Manna and ambrosia from heaven”
D500: Iron oxide dust colours the air and the waters red
A) Effect of Nibiru: Earth's increasing wobble of the spin axis
Earth’s orbit around the Sun was blocked by Nibiru in December 2003. In the next months also Venus got blocked in its orbit, and Earth’s twin closed in on Earth from behind. Earth was thus in a “trapped” constellation, which early in 2004 had the effect that Earth in its diurnal (24 hours) rotation got an increasing wobble around the imaginary north-south axis. From ZT Chat 12. Nov 2011:
“The Earth wobble has changed over the years, since Planet X arrived in the vicinity in 2003. In 2003 when the wobble first started, the magnetic grab was of the S Pole of Earth, creating a twice a day wobble that occurred at approximately 12:00 UTC and 0:00 UTC, when the Atlantic Rift either faced the Sun and the approaching Planet X or was in opposition on the dark side of the globe. As Planet X moved past the Sun and outbound, trapping Earth in the cup, the wobble changed. Planet X has a retrograde orbit, is coming at the Earth from the right, and the S Pole and Atlantic Rift grab was thus occurring slightly before the prior times, 3 hours earlier more aligned with 9:00 UTC and 21:00 UTC.
By mid-2004 a polar push pattern had emerged, where the N Pole of Earth was being pushed violently away daily, and this violence has been increasing of recently. The distinctive Figure 8 wobble pattern was identified by December, 2004.
With Planet X remaining slightly to the right, though coming closer to Earth all the time, the Earth is doing more twisting about trying to align with both the Sun and Planet X. At times she is even going into opposition, trying to point her N Pole at Planet X. Battering by the other planets caught in the cup - Venus and the Dark Twin - also enter into the picture. Thus ricochet and reverberation enter in. The Earth may lean one way and suddenly lean another, creating great stress along plate borders and this is absolutely a factor in why the plate movements are increasing, apace. Thus the twice a day wobble has gotten complicated, and will become increasingly hard to predict or even interpret.”
A film team involved in making the documentary Before Tomorrow, about the Inuits’ views on climate changes and the melting of the polar ice, were quite surprised when several of the Inuit groups, independently of each other, and they were not prompted on the issue, started to talk about several symptoms of Earth having got a marked wobble of the axis spin (source: Ian Mauro 25 Nov 2009). The Inuits live on all sides of the Arctic Ocean.
A100: Earth’s tectonic plates are wrenched and shakened loose from each other and set in motion
Per the Zetas, Earth has since 2003 been trapped in a constellation between four other planets: Nibiru in front moving northwards towards the ecliptic and outwards towards the orbit of Venus; the Earth’s twin planet is now being blocked behind Earth (they share the same orbit); Venus in the neighbour orbit on the inner side to the left (if the observer is standing on the N Pole facing forward in Earth’s orbit); and Mars in the neighbour orbit on the outer side to the right (if the observer is standing on the N Pole facing forward in Earth’s orbit). In this constellation of being trapped, Earth is continually being pulled forwards and backwards, experiencing a sort of whiplash effect which set the tectonic plates under enormous strains. In addition, the Earth is experiencing a wobble of the spin axis, with the result that the northern and southern hemispheres are being wrenched in opposite directions.
First, the northern hemisphere is being wrenched eastwards (in the direction of the Earth’s rotation) while the southern hemisphere is being held back. Then the southern hemisphere is being wrenched westwards while the northern hemisphere is being held back. The Zetas call this The torque effect. The whiplash effect and the torque effect become more forceful the closer we come to the Earth crust displacement, and these effects are reflected in ever more dramatic phenomena related to the tectonic plates.
The tectonic dramas at times become top news in the media, as with catastrophical earthquakes, but the media present most of the manifestations of the tectonic dramas as isolated events “just happening”. The media give all the attention to the consequences of the manifestations, like the personal tragedies and the socioeconomic losses related to earthquakes, leaving the reader in the dark of the deepest causes behind the manifestations.
The Earth being trapped in a constellation between four planets,
in this position being pulled forwards and backwards.
Plate tectonics is a geoscientific subdiscipline with status of being the prevailing scientific theory about the movements of the Earth’s crust. Plate tectonics had its breakthrough at the end of the 1960s, and brought new life to Alfred Wegener’s (1880-1930) hypothesis of continental drift from 1915. From a ZetaTalk persperctive, the greatest weakness of plate tectonics is the way it is rooted in the dogma of gradualism instead of catastrophism [Wiki: Catastrophism]. Catastrophism is the idea that Earth repeatedly has gone through short-lived global cataclysms, which the Zetas relate to Earth crust displacements.
Let us start with ZetaTalk’s version of the origin of Earth. A water planet, which according to Zecharia Sitchin was called Tiamat by the Sumerians, had its orbit around the Sun where the orbit of the Asteroid belt now is, between Mars and Jupiter. During one of Nibiru’s passages through the ecliptic, one of the many moons of Nibiru, or meteors in its tail, crashed with Tiamat, smashing Tiamat in many pieces. The biggest piece became Earth, and the world ocean rushed down in the gigantic impact crater, which thus became the Pacific Ocean basin. The Earth then got the orbit of today.
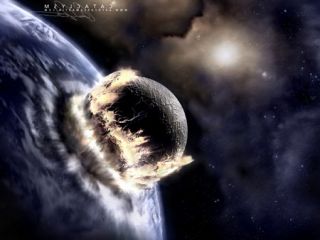
We can imagine this as an illustration of one of Nibiru’s moons crashing with Tiamat,
creating the Pacific Ocean basin.
When the world ocean had rushed down into the Pacific Ocean basin, an earlier world of oceanic plateaus and ridges stuck above the ocean for the first time, full av mud and sea shells. Thus emerged the original supercontinent that Wegener in his hypothesis assumed must have existed, and which he named Pangeae. On the top of Mount Everest one can still find shells, which shows that this ridge once upon a time was oceanic.
The Zetas reject the theory of continental drift, at least in the sense that the continents very, very slowly have drifted away from each other. They claim instead that the general trend is that the Earth crust displacements result in fracturing, rifting and finally splitting of the tectonic plates [ZT note: Continental Drift (1995)]. So, instead of talking about continental drift, it would be better to talk about plate rifting and splitting. The macrotrend of the displacements with their plate rifting and splitting is that Earth, as a planet sailing through space, becomes ever more balanced and harmonized what concerns the geographical distribution of oceans and continents.
According to plate tectonics, the Earth’s crust consists of 7 large and 30-40 smaller tectonic plates being in close contact with each other (Wiki: List of tectonic plates). The boundaries between the plates are called plate boundaries. There are three types of plate boundaries:
* convergent, or collisional boundary. This will either result in a subduction zone where an oceanic plate moves beneath an oceanic or continental plate, or result in a continental collision between two continental plates leading to mountain range formation (like the Himalayas). Subduction zones result in enormous earthquakes and deep oceanic trenches.
* divergent boundary, which means that the two plates are moving away from each other. This results in a spreading zone with the formation of new crust between the two plates. These areas can form in the middle of continents but eventually form ocean basins. Divergent boundaries within continents initially produce rifts which then extend to produce rift valleys. The most active divergent plate boundaries are between oceanic plates, where mid-oceanic ridges (like the Mid-Atlantic Ridge) are formed in the sea floor spreading zone.
* transform fault (or transform boundary) occur where plates slide past each other, and crust is neither destroyed nor created.
The plate boundaries represent fundamental zones of tectonic disturbances. Almost all earthquakes and volcanic activity happen here. Rifts can be interplate (in a divergent boundary) as well as intraplate (a plate in the process of being split in two). The intraplate rifts which the Zetas mention most frquently, are Rift Valley in East Africa (Wiki: East African Rift) and New Madrid Seismic Zone in Eastern USA (Wiki: New Madrid Seismic Zone).
* Wiki articles: Plate tectonics; List of tectonic plates; Mid-Atlantic Ridge; Rift.
* ZT note: Whiplash (2004).
A110: Stretch zone phenomena where rock layers are being pulled apart because the tectonic plate is being drawn in opposite directions simultaneously.
The Zetas have introduced the term “stretch zone”, which includes both interplate and intraplate rifting. The term is used especially in cases of intraplate rifting due to the present wrenching and shaking of the tectonic plates. Some of these plates are being drawn in opposite directions simultaneously. In Western Saudi Arabia, not far from the Red Sea where the African plate and the Arabian plate share boundary, one can now see the development of a gigantic rift in the earth (see the article Earthquakes continue in western Saudi Arabia). While some try to explain this as “undetermined volcanic activity”, per the Zetas, the two plates will be pulling apart as the Earth changes proceed. On 6. July 2012 a 15 km long, 4 meter broad and 60 meter deep crack opened up in Dolores Hidalgo, Mexico (see article in Examiner.com, Gigantic crack opens earth in Dolores Hidalgo, Guanajuato, Mexico).
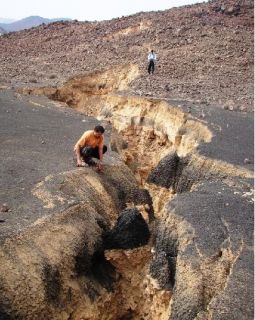
A stretch zone in Saudi Arabia due to two plates pulling apart.
The characteristic of intraplate stretch zones is that the rock foundation is sinking, failing and/or changing position. Due to the Zetas having the USA as its main target of mission, the New Madrid Seismic Zone in Eastern USA is the stretch zone most frequently mentioned (Wiki: New Madrid Seismic Zone). See the ZT notes: Stretch Zone (2004), North American Rip (2006) and The stretch zone: that sinking feeling.
A111: Structures and buildings imploding; pipes and Internet cables breaking
One of the consequences of rock foundation sinking, failing or changing position, is that pipes and Internet cables laid upon such a foundation will be stretched and come under tension, and may finally break. Structures, buildings and whole cities resting upon such a foundation may collapse and implode.
* ZT nl 10. Feb 2008. Offshore Internet cables five miles from Alexandria, Egypt, breaks.
* ZT nl 24. Feb 2008. An oil pipeline and an oil refinery in Texas explodes.
* ZT nl 29. Mar 2009. A German building implodes; ZetaTalk predictions from 2002.
* ZT nl 16. May 2009. A gas pipeline explodes in Moscow; greatest explosion since WW II.
* ZT nl 23. May 2009. Buildings imploding during the same week in Tecumseh (Oklahoma), Waterloo (Iowa), Bristol (Pennsylvania) and Walthamstrow (UK).
* ZT nl 1. Nov 2009. A very powerful explosion at Caribbean Petroleum Corp., outside of the capital of Puerto Rico. Stress between two tectonic plates caused a gas pipe to snap, sparks were created, and thus the explosion. The explosion could be compared to an earthquake with magnitude 2,8.
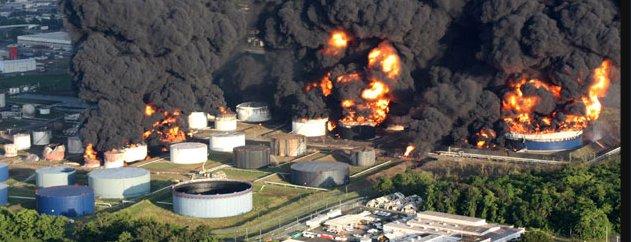
A very powerful explosion at Caribbean Petroleum Corp. on October 24, 2009.
A112: Bridges collapsing
One of the consequences of rock foundation sinking, failing or changing position, either at one or at both sides of a river, is that bridges crossing the river may be wrenched more than they can endure, and collapse.
* ZT nl 5. Aug 2007. A bridge in Minneapolis and a bridge in Oroville, California, collapse.
* ZT nl 30. Sep 2007. A bridge under construction in Vietnam collapses.
* ZT nl 30. Aug 2009. During two months bridges have collapsed in India, Ireland, Winnipeg, Iowa, Mexico and China.
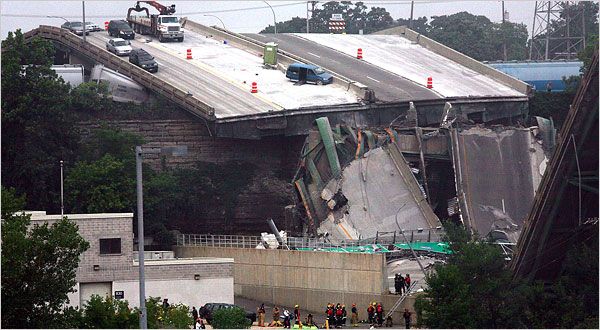
Bridge over Mississippi river collapsing on August 2, 2007.
A113: Sinkholes
Sinkholes occur most frequently in karst landscapes (Wiki: Sinkhole). What geologists will not tell media, is why there has been an enormous increase in sinkholes the last ten years. The answer is tectonic activity that produce increased tension and dynamics in the stretch zones. The new sinkholes that the Zetas discuss, are all related to stretch zones.
* 13 of the Biggest, Strangest, and Most Devastating Sinkholes on Earth. Article in WebEcoist, dated August 26, 2008.
* ZT nl 1. Apr 2007. More than 100 sinkholes in the province Guangxi, China.
* ZT nl 11. May 2008. Sinkholes in Texas, Mexico City and Guatemala.
* ZT nl 23. May 2009. Sinkholes in Springfield (Missouri) and in Cleveland (Ohio).
* ZT nl 12. July 2009. Sinkholes in New Jersey and in Calgary, Canada.
* ZT nl 25. Oct 2009. A sinkhole appeared in the middle of a church in Naples, Italy, on September 23, 2009.
* ZT nl 16. May 2010. 26 sinkholes in the province Sichuan, China. In California two cars were swallowed by a sudden sinkhole. In Quebec (Canada) a gigantic sinkhole swallowed a house, several persons being inside the house died.
* ZT nl 20. June 2010. More about the outbreak of sinkholes in China and Guatemala.
* ZT nl 23. Oct 2011. The number of sinkholes in Florida has increased from 2360 in 2006 to 6694 in 2010. This dramatic increase has resulted in a new legislation being worked out in order to save the insurance companies from going bankupt [media article].
* MailOnline (Apr 2013): The Russian city being 'eaten alive': Cars, buses, and trucks disappear beneath the earth as they are swallowed by giant sinkholes.
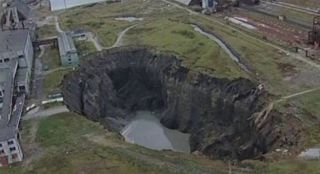 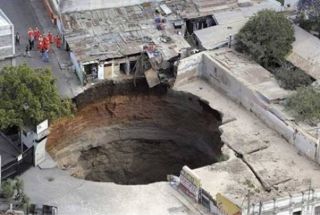
Sinkholes suddenly appearing in Berezniki (Russia) and near Guatemala City (Guatemala).
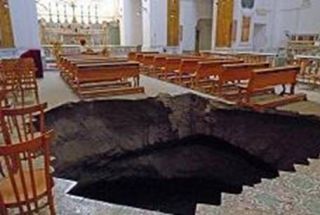
A sinkhole appeared in San Carlo alle Mortelle church in Naples on September 23, 2009.
A114: Sounds from stress and adaptations in rock layers and tectonic plates, and booms from air layers clapping together
Nancy’s first compilation of notes on these two sound phenomena was in ZT nl 23. Mar 2008. The Zetas then elucidated the subject in ZT Chat 29. Nov 2008 and in ZT Chat 11. Dec 2010.
From March 2011 and onwards, recordings were done of sounds reminding of howling and brass instruments. In the ZetaTalk note Trumpets and Howls (Aug. 2011) these sounds are explained as underground vibrations, in areas being in a stretch zone, triggering a resonance in dams and lakes above, and then finally the vibrations are amplified by the air. Each case has its own fascinating sound nuances:
- in Kiev (Ukraine), like at tibetan horn (YouTube).
- in Tampa Bay, Florida, a somewhat scary howling (YouTube).
- in Homel (Belarus), as from an underground fabric (YouTube).
From ZT Chat 21. Jan 2012:
“Where is this leading? At least half the Earth, at any given point in time, will be having some sort of tension in its rock. Clapping and grinding fault lines, vibrating bodies of water, trembling rock strata resisting being pulled apart, and snapping rock under compression or being bent. All will be noisy, and the most likely reaction among those who hear it will be to conclude that the End Times have arrived. However known in various cultures around the world, all have some reference to the coming times. The establishment will be unable to explain away these sounds, and once again the Internet will be sought and will lead inevitably to our explanations.”
* What are they? Mysterious unexplained noises now being reported across the globe. The Extinction Protocol, 17 Jan 2012.
* The mystery about the strange and scary sounds from above. alienspacecentereast's blog, updated on March 2012. Includes a list of links to ca. 50 YouTube videoes with recordings of strange sounds from all over the world.
* On 6. December 2012 unexplained booms could be heard for a period of 24 hours from the westside (Arizona) to the eastside (Rhode Island) of USA. See ZT nl 30. Dec 2012.
A120: Earthquakes
Earthquakes are the release of great intraplate or interplate tension. Almost all earthquakes are interplate, since the tension is greatest here. Intraplate earthquakes are relative rare, little understood, and occur in rift zones like New Madrid Seismic Zone. Magnitude scales like Richter magnitude scale and Moment magnitude scale (MMS) are logarithmic. As with the Richter scale, an increase of one step on this logarithmic scale corresponds to ca. 32 times increase in the amount of energy released, and an increase of two steps corresponds to ca. 1000 times increase in energy.
- The significance of deep earthquakes
The Zetas explain in their note Deep Quakes (1997) the significance of deep earthquakes. Further, they predict that official earthquake databases may soon hold back information about the earthquakes' depth.
“One of the surest signs that the current eccentricity in weather patterns and the increased magnetic diffusion exhibited by the Earth’s core and the warming of the oceans from the bottom up are not simply variations on the norm, is the dramatic increase in deep earthquakes, as noted since the mid 1980’s. This of course gets little media attention, just as the increasing magnetic diffusion is not in the media, as they are difficult symptoms to explain. The increase in deep earthquakes, those indicating plate adjustments at the most fundamental level, are in particular a telling clue that a pole shift is in the Earth’s near future. Few earthquakes register at this level normally, as most quakes registered by man are on the fragile and easily crumbled surface.
The snapping or crumbing surface affects mankind’s habitat directly, so that surface quakes are noticed. Deep quakes rock the boat but don’t normally throw the crockery about, moving the plate as a whole rather than adjusting the surface. Therefore deep quakes result in little damage, and thus get little media coverage. However, as a symptom heralding the coming pole shift, they are extremely significant and more importantly, unexplainable in any other context. The increase in deep earthquakes is currently reported, but as these increase and attention is focused on this curious symptom, the current availability of these statistics may be blocked. Earthquake data is reported by location, date and time, Richter scale magnitude, and depth. Expect that latter piece of information to be dropped in the future.”
- USGS has cheated with earthquake statistics since 2003
U.S. Geological Survey (USGS), running an official database in which earthquakes worldwide are being registered, has according to ZetaTalk since 2003 cheated by underreporting the number of earthquakes, and by giving the registred earthquakes lower magnitudes than what is measured. In this way the government is trying to present the global plate-tectonic drama as far less alarming than it really is. With this less alarming presentation they hope to avoid public speculation about the cause of the increase in earthquake activity. See ZT Newsletter Dec 24, 2006.
USGS web-pages of interest:
* USGS: Earthquake Lists & Maps
* USGS: Are Earthquakes Really on the Increase?
* USGS: Earthquake Facts and Statistics
* USGS: Earthquake Facts and Statistics Graphs
* USGS: Earthquake Glossary
- The most relevant unit for measuring EQ trends is total released energy
From USGS’ webpage How much bigger is a magnitude 8.7 earthquake than a magnitude 5.8 earthquake?:
“The magnitude scale is really comparing amplitudes of waves on a seismogram, not the STRENGTH (energy) of the quakes. So, a magnitude 8.7 is 794 times bigger than a 5.8 quake as measured on seismograms, but the 8.7 quake is about 23,000 times STRONGER than the 5.8! Since it is really the energy or strength that knocks down buildings, this is really the more important comparison. This means that it would take about 23,000 quakes of magnitude 5.8 to equal the energy released by one magnitude 8.7 event.”
Given the acknowledgement above from USGS, one may wonder why they don’t produce diagrams that show the global total EQ released energy per year. To find such diagrams, it is necessary to turn to the website dlinquist Earthquake Home, which is run by a single person. The raw data from USGS are being transferred automatically and continually to a data program at dlindquist which calculates the released energy, which is then shown at the diagrams y-axis.
On the horizontal Menu Option, choose ”Historical Activity”. The diagrams will then show EQ activity for the period 1973-2011. On the vertical Menu Option, choose ”All Quakes” and ”Total Strength” (”Strength” is released energy). The diagram will then show:
- that in the year 2003 a dramatic increase started.
- that 2004, 2007 and 2010 were three top years at approximately the same level.
- that the year 2011 per August already is ca. 70 % higher than the three top years, and that 2011 at the end of the year most probably will be far above 100 % higher!
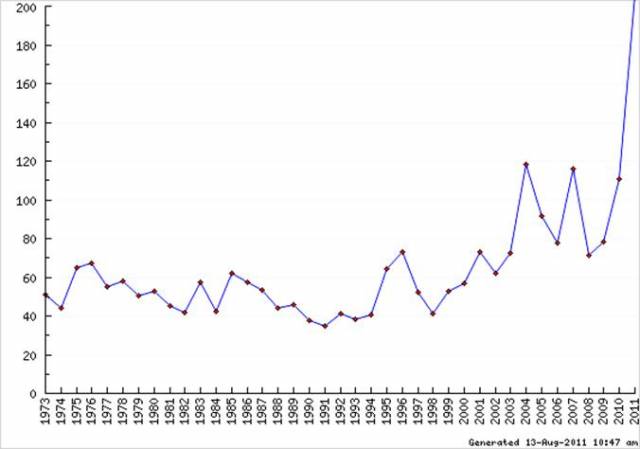
dlindquist’s diagram shows the total global EQ released energy for the period 1973-2011.
- ZetaTalk newsletters discussing earthquakes:
* ZT note July 2004. Earthquakes occuring at the same time worldwide started in March 2003, and a pattern was established from May 25, 2003.
* ZT nl 16. Sep 2007. About the powerful earthquakes in Sumatra in December 2004 and September 2007.
* ZT nl 7. Oct 2007. Earthquakes with M>4 worldwide at the same time; an exponential increase has started.
* ZT nl 30. Nov 2008. The trend with earthquakes, M = 5-7, worldwide at the same time continues. FEMA warns the population in the New Madrid Seismic Zone about possible catastrophes.
* ZT nl 18. Jan 2009. Official earthquake statistics 2002-08, showing that there was a dramatic increase in 2007.
* ZT nl 12. July 2009. A statistic diagram for the period 1900-2008; a summing-up of USGS’s cheating with statistics since 2003.
* ZT Chat 16. Jan 2010. The earthquake in Haiti on January 12, 2010, was just a foretaste of what will happen to all of the Caribbean and Central America. According to ZetaTalk, the earthquake was far more powerful than the official magnitude of 7,0. See also USGS report.
* The earthquake in Chile on February 27, 2010. The earthquake, which occurred off the coast of the Maule Region of Chile, was the sixth strongest earthquake in the world since recordings started around 1900. With a magnitude of 8,8 it was 501 times stronger than the 7,0 quake in Haiti in January.
* ZT nl 25. Apr 2010. The earthquake on March 13-14, 2010, on the Tibetan Plateau, may have killed as many as 10.000 persons. The earthquake was measured to a magnitude of 7,1. This was an intraplate earthquake (in contrast to an interplate), which is relatively rare.
* Wiki: 2011 Tohoku earthquake and tsunami. The EQ off Japan’s east coast on March 11, 2011, was officially given M=9.0, which makes it the fifth most powerful EQ since recordings started around 1900.
* Wiki: Lists of earthquakes #Largest eartquakes by magnitude. Of the ten most powerful earthquakes in the period 1900-2012, five of them have occurred from 2004 and og utover.
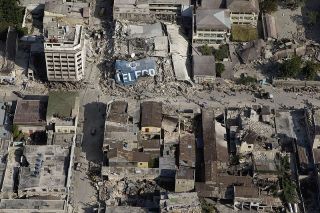 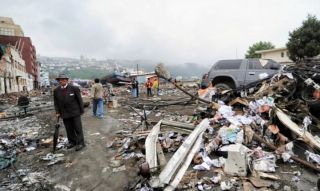
Earthquake in Haiti on January 12, 2010. Earthquake in Chile on February 27, 2010.
A130: Volcanic activity
Both the Earth’s wobbling and shaking in itself, and the consequence hereof, the tectonic plates being wrenched and shakened loose from each other and set in motion, contribute to an increase in volcanism. Smithonian Institution is responsible for the website Global Volcanism Program, where one finds statistics for historical, yearly and global volcanic activity. According to their database, the number of eruptions per year have been fairly stable the last centuries, and from 1960 to 2003 have been stable between 50-67 eruptions per year (source). To search for the number of eruptions per month or year, go here. Below the headline ”Find a volcano by eruption date” one can fill in year and/or month. The database gives the following statistics for the years 2004-10, the volcanism being just a little bit higher than usual:
2004: 71
2005: 73
2006: 76
2007: 71
2008: 76
2009: 67
2010: 69
2011:
ZetaTalk has in several notes expressed that the global volcanism has increased significantly the last years. In that case the Smithonian Institution has cheated and underreported the actual number of eruptions.
* Wiki: Volcanism.
* ZT note: Magma void (2005).
* ZT nl 28. Mar 2010. The volcanic eruption on Iceland is explained in the context of the expansion of the Atlantic.
A150: The release or increased pressure of gases and liquids in pockets between rock layers
During an Earth crust displacement vegetation may be trapped between two rock layers, and may lie there and rot for thousands of years until the rock layers for some reason are torn apart, e.g. during the prelude to the next Earth crust displacement. The putrefaction creates gases, like:
Tectonic changes may reduce the volume of some petroleum-filled reservoirs, leading to an explosive high pressure in petroleum wells.
A151: The Earth releases stinking methanethiol; the Tunguska event (1908)
Methanethiol has a penetrating odor associated with rotten cabbage, rotten eggs and flatus, and is in fact a component in bad breath, flatus and feces. When trapped methanethiol is released from rock layers torn apart, humans out in the nature may think that they are close to a swamp, while those in towns may believe that there has been a gas leak. Some times movements in one tectonic plate may cause adjustments in other plates, and thus trigger a tectonic domino effect worldwide. Per the Zetas, such a worldwide effect occurred on 8. January 2007; reports of a putrid smell coming in from all over the world.
* ZT note: Earth Farts (2007). About 8. January 2007.
* Examiner.com: Infamous ‘Earth Fart Day’: The stench smelled around the world (Sep. 2012). About 8. January 2007.
* ZT nl 24. Feb 2008. About a putrid smell all over Indiana.
* ZT Chat 26. Jan 2013. About the stench of methanethiol from London to Paris on 22. January 2013, which was explained away as a gas leakage in the fabric Lubrizol France near Rouen.
- The Tunguska explosion in 1908
One of the great mysteries of science is what caused the incredibly powerful explosion in Tunguska, in the middle of Siberia, on June 30, 1908 (Wiki: Tunguska event). ZetaTalk touches on this issue in an answer to a question (ZT Chat 5. June 2010):
”Methane gas… can cause explosions as was the case for the Tunguska explosion. A quake split the permafrost, releasing methane gas into the air. This pool of gas rose into the upper atmosphere, as methane is lighter than air, and when sparked by lightning, exploded. The explosion followed the path of rising methane back to the ground in Siberia, in Tunguska. Can this type of explosive behavior be anticipated as quakes increase around the world? Yes, but such explosions will be extremely rare.”
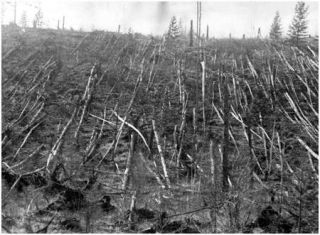
Tunguska 1927 (19 years later!)
A152: Released coalbed methane: Mass deaths of birds and fish
Per the Zetas, the release of coalbed methane (CBM) is the cause of the sudden rise of mass deaths starting in December 2010. Their comment in ZT Chat 8. Jan 2011:
“Dead fish and birds falling from the sky are being reported worldwide, suddenly. This is not a local affair, obviously. Dead birds have been reported in Sweden and N America, and dead fish in N America, Brazil, and New Zealand. Methane is known to cause bird dead, and as methane rises when released during Earth shifting, will float upward through the flocks of birds above. But can this be the cause of dead fish? If birds are more sensitive than humans to methane release, fish are likewise sensitive to changes in the water, as anyone with an aquarium will attest. Those schools of fish caught in rising methane bubbles during sifting of rock layers beneath them will inevitably be affected. Fish cannot, for instance, hold their breath until the emergency passes! Nor do birds have such a mechanism.
And why would Sweden have clouds of methane being released when it is not even on a fault line? Nor is Brazil on a fault line, though New Zealand and the New Madrid region in Arkansas are. We have often stated that the plates have had the rock fingers preventing movement along their edges broken off, so they have become slippery. In this state, they are now pressed against each other under the stress of a more violent and rattling wobble. The stress is evident on all plates, which are shifting around, internally, under the strain. Thus methane, so poisonous to birds and fish, is being released.”
* ZT nl 9. Jan 2011.
* ZT nl 3. July 2011.
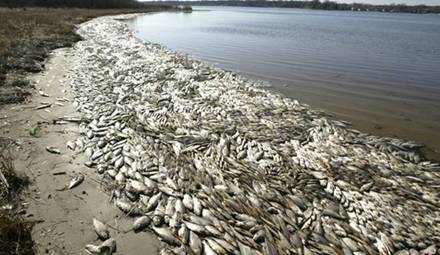
Mass death of gizzard shad on the Chicago lakefront on January 14, 2011.
In October 2012 a halo in the clouds was seen at the same that dead birds were falling from the sky. MailOnline had an article about this case: What on earth WAS this? Man photographs 'UFO' floating in the clouds moments before ten dead birds appear in garden. The Zetas commented the article in ZT Chat 27. Oct 2012:
”Clues to the reason for the halo cloud above Sellafield lie in the dead birds, of more than one species. Methane kills birds readily, the reason coal miners took canaries into the mine shafts with them. When they stopped singing, there was danger of an explosion. The methane poof over Sellafield created the pretty halo outline in the clouds, as methane is lighter than air and thus rises.”
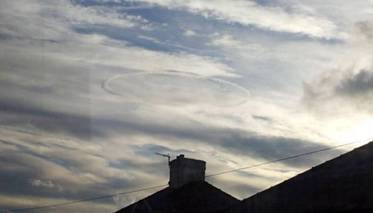
A halo in the clouds at the same time that dead birds were falling down.
A153: Exploding manholes
New York City experienced experienced in January 2011 a record high number of exploding manholes: 65. In January 2010 it was only 10, and in January 2009 the number was 21 ( Reuters, 4. Feb 2011). The Zetas gave an explanation in ZT Chat 19. Feb 2011.
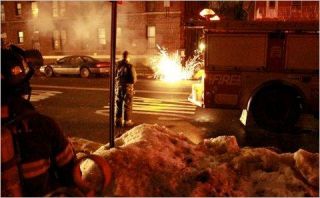
A record high number of exploding manholes in NYC in January 2011.
A154: Explosively high pressure in petroleum wells
Tectonic changes may reduce the volume of some petroleum-filled reservoirs, leading to an explosively high pressure in petroleum wells.
* ZT nl 13. June 2010. About the primary cause of the oil spill catastrophe that Deepwater Horizon triggered on April 20, 2010, and about two other petroleum wells that had problems with explosively high pressure.
A160: Greater tectonic adjustments
* ZT nl 25. Apr 2010. The Coral Sea ocean floor near Australia has probably risen 100 meters in just 24 days in March-April. 500 km further away the sea level has fallen with 39 meters.
A200: Extreme weather, extreme temperatures, climate chaos
Per the Zetas, it is the Earth’s wobbling that is the primary cause of the increasing extreme weather, extreme temperatures and climate chaos, NOT the ongoing warming up from the Earth’s core which spreads outwards toward the Earth crust, the oceans and the troposphere. See ZT note Weather extremes (2005) and ZT nl 11. Sep 2011.
A210: Extreme temperatures (heat and cold records)
The Zetas gave the following comment in ZT Chat 1. March 2008:
“This past winter has been horrific for the northern hemisphere, where the N American continent and areas of Siberia have suffered record breaking cold and snow fall. The cold has been, in many places, intractable. This is not a global warming issue caused by heating air at all, as we have explained the heating of the Earth is from the ground up, due to the swirling core of the Earth. This is why there are more volcanoes active at this time than in the memory of man. The record cold is due to the Earth wobble, the pushing away of the magnetic N Pole of Earth when it presents daily on the horizon and is subject to the push of magnetic particles coming from the N Pole of Planet X. This pushes those parts of the globe away from the warming Sun!”
* ZT nl 30. Mar 2008. Cold records in n. hemisphere; heat records in s. hemisphere.
* ZT nl 7. Sep 2008. The Arctic sea ice is melting.
* ZT nl 8. Feb 2009. The pattern of extreme temperatures becomes more complex, taking the shape of vertical bands over the globe.
* ZT nl 2. Aug 2009. Over 3000 cold records in USA.
* Richard S. Lindzen: Resisting climate hysteria (26. July 2009).
* ZT nl 17. Jan 2010. Cold- and snowfall records all over the n. hemisphere. Western Europe is experiencing one of the coldest winters for several decades. The Eastern USA is experiencing the coldest winter since 1985. Seoul, South Korea, is experiencing the heaviest snowfall since such meteorological recordings started in 1937. Beijing is experiencing the coldest winter in 40 years.
* ZT nl 11. July 2010. Snow on summer solstice in Austria; frost warning in Oregon in June.
* ZT nl 18. July 2010. Cold and heat records all over the world in the summer 2010.
* Wiki: 2010 Northern Hemisphere summer heat wave.

A koala being thankful for a bowl of water during a heatwave in Australia!
A220: Hurricanes and tornadoes
The Zetas gave the following comment in ZT Chat 31. May 2008:
“The more violent wobble is inciting tornadoes over the N American continent in several ways. First, it drives the Earth under her blanket of air twice daily. During the Figure 8 the N Pole of Earth forms daily, the Earth first leans her magnetic N Pole away from the Sun when it rises up over the horizon at dawn, and then leans her magnetic N Pole away from the Sun toward the other direction ahead of sunset. Since the magnetic N Pole is in the Arctic between Canada and Siberia, this lurching about affects the N American continent primarily. What happens when the N American continent is pushed into the north Pacific at dawn, and again into the north Atlantic at dusk? Cold air is driven over the warm air found overland - precisely what tornadoes need in order to form. A tornado is a pool of cold air atop a pool of warm air. The cold air drops, and spirals as it does so. As the N American continent has warmed inland due to the change of seasons, the contrast between air over the northern oceans and the air inland has increased. Thus the increase in tornadoes during May. What will happen as the continent warms during summer, increasing the contrast? The cold air driven atop the now hot air will find a greater contrast, and tornadoes will increase!”
* ZT nl 9. Mar 2008. Hurricanes all over Europe.
* ZT nl 1. June 2008. Record high number of tornadoes in USA.
* ZT nl 21. Sep 2008. The hurricane Ike which swept Texas.
* ZT nl 4. Apr 2010. The first two hurricanes/cyclones ever to be recorded at the east coast of South America, occurred in March 2004 and March 2010.
* Wiki: 2011 Pacific hurricane season; 2011 Atlantic hurricane season.
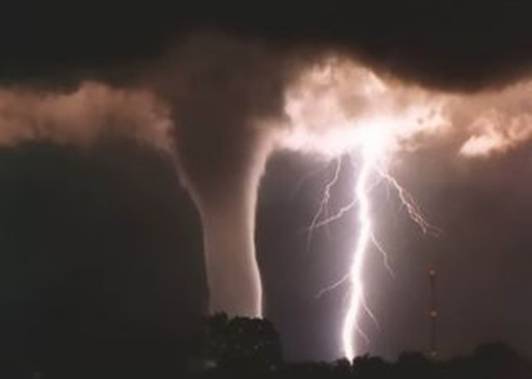
Tornado
A230: Extreme hailstorms
Nancy Lieder wrote in ZT nl 16. Dec 2007:
”Another myth reported in folklore relates to severe hailstorms, one of the plagues that afflicted the Egyptians during the time leading into the Jewish Exodus. The last pole shift occurred during the time of Moses, approximately 3,600 years ago, and the time of the plagues and the shift itself were recorded both in the Book of Exodus and by the Egyptians. Both of these accounts contain tales of severe hailstorms, and the descriptions are remarkably similar.”
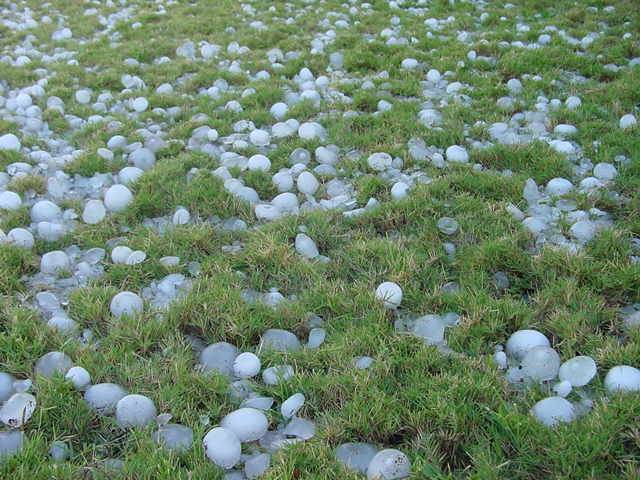
Hail as big as snowballs
A240: New and rare types of clouds
The Zetas explained in ZT Chat 6. June 2009 how a ”wobble cloud” is formed:
”We have mentioned several effects of the Earth wobble, such as jet stream loops and extreme temperature changes. Where in general the atmosphere drags along with the Earth's surface, there is a lag, which is what causes the prevailing westerlies. When the Earth is pulled under an air mass of a different temperature, the air can rise or plunge, the typical scenario of a summer thunderstorm. But what occurs when such an air mass is pulled under another, and they returned to its former position? Instead of a thunderhead forming, the process is aborted, leaving a layer of moisture heavy clouds instead. That this cloud formation has only been seen recently links it to the Earth wobble, which has only been present since 2004.”
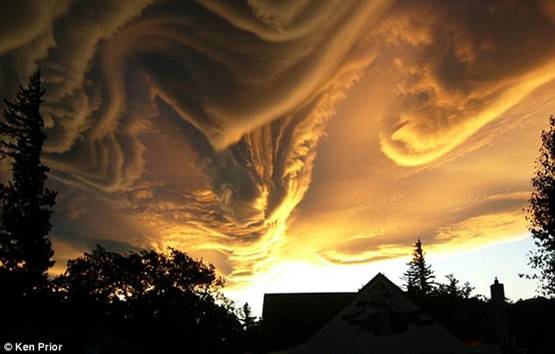
Wobble cloud
A260: Giant tidal bores and tidal floodings (unrelated to storms and to tsunamies caused by submarine earthquakes)
From the Wiki article Flood:
“A flood is an overflow of an expanse of water that submerges land. The EU Floods directive defines a flood as a temporary covering by water of land not normally covered by water. In the sense of "flowing water", the word may also be applied to the inflow of the tide. Flooding may result from the volume of water within a body of water, such as a river or lake, which overflows or breaks levees, with the result that some of the water escapes its usual boundaries.”
Floods can occur as a result of several types of causes and partial causes, like: a) heavy rains that cause rivers to overflow, b) Sinking of land, caused by subduction of a tectonic plate, with the result that the ocean inundates the coastline. This inundation will simultaneously prevent running water coming from floods and rivers higher up in the terrain from draining, c) the Earth’s wobble results in giant “wobble waves” that cause catastrophic floods. We will here focus on the last phenomenon.
Tidal bores occur in river and bays, normally caused by the gravitational forces of the Moon, the Sun and some planets. [A tsunami is a completely different phenomenon. A tsunami is a series of water waves caused by the displacement of a large volume of water, usually in the ocean. The displacement is usually being caused by a submarine earthquake].
* Wiki articles: Flood; Tidal bore; Storm surge; Tsunami.
* ZT nl 27. May 2007. Giant tidal waves in Indonesia.
* ZT nl 5. Aug 2007. Floods worldwide.
* ZT nl 2. Dec 2007. Floods in England and Jakarta.
* ZT nl 2. Aug 2009. Wobble tides.
* ZT nl 27. June 2010. In just two weeks extreme floods in Oklahoma/Arizona, France, China, Brazil and Canada.
* ZT nl 6. Nov 2011. Giant wobble waves in Dublin (Ireland) and Tabasco (Mexico).
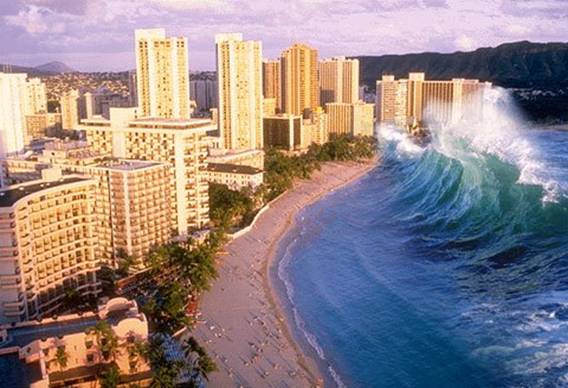
Illustration of a wobble wave.
A270: Maelstroms
The Zetas associate maelstroms with a sudden seafloor displacement, which makes an association between maelstroms and tsunamies.
* Wiki: Maelstrom.
* ZT note: Ocean Vortex (1996):
“These giant whirlpools have been recorded by the ancients, as their ships on occasion were caught in them during a pole shift. When one of the fleet managed to escape, the tale was told and recorded. However, as with many pole shift generated tales, these tales are taken to be myths.”
* ZT nl 16. Dec 2007. About a ship lost in a maelstrom off the coast of Taiwan.
* An impressive whirlpool was created at Uzumaki during the earthquake and tsunami at Tohoku (Japan) on March 11, 2011. Video.
* April 2011: Two giant maelstroms in the Atlantic off the coasts of Guyana and Suriname (The Extinction Protocol April 12, 2011).
* ZT nl 24. Apr 2011: A review.
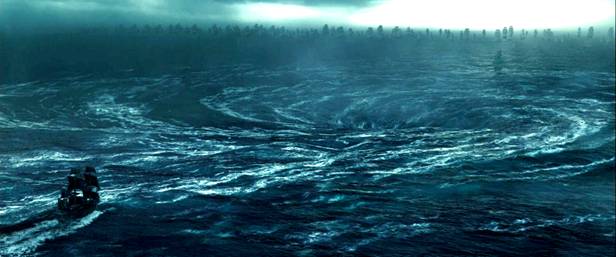
Illustration of a giant maelstrom
A400: Various economical, technological and productional consequences
The Earth’s wobbling and shaking sets in motion massive nature forces worldwide, which – combined with the increasing extreme weather, extreme temperatures and climate chaos – cause enormous material damage and destruction, technological disturbancies and productional obstructions.
A410: Catastrophic fall in global food production, and thus global food shortage
Droughts and the many flood catastrophies have resulted in a catastrophic fall in the global food production, with global food shortage as the consequence. Global food shortage reached a new level in year 2000, when food shortage was reported in 77 countries. Nancy Lieder wrote in ZT nl 23. Dec 2007:
“Reports of crop shortages increased exponentially in 2000, and by late 2002, a UN Report documented the extent as worldwide, devastating, and due to weather related problems. But the media was still underreporting crop shortages. The Zetas repeated their warning.
ZetaTalk Prediction 7/29/2005: Lands used to regular rains, now suffering droughts, may find these droughts turning their land into deserts. Rain forests may fear being washed away as rain comes not only more often but with a greater load of water. Drought or deluge, there will be few places on Earth not affected by one of these extremes, and all of this affects the success of crops.
Worldwide, food stores were shrinking, but this was also not discussed in the media. By 2007, the fact that crop shortages were occurring and grain stores were depleting was finally being admitted, and the price of food was rising dramatically…
But when the subject is discussed on CNN or other major media, the poor grain harvest was put in the context of being caused by an ethanol craze, the need to use corn for fuel. The fear is that the public will panic when they realize not only that crops are failing but that the grain silos are also depleated. This fear was admitted in a recent publication in the UK.”
* ZT nl 23. Dec 2007. A summing-up.
* ZT nl 6. Apr 2008. Jump in rice price; food stamps and soup kitchens are reintroduced.
* ZT nl 15. Feb 2009. A report from Global Research; draught is the primary reason to food production failure, from Australia to USA and South America.
* ZT nl 21. June 2009. UN report says one billion are starving.
A430: Record high costs for natural disasters, according to reinsurers
The website The Extinction Protocol: 2012 and beyond has a theme page with focus on reinsurers costs for natural disasters. Already in August 2011 the top reinsurer in the world, Munich Re, could declare that 2011 would be their worst year in history. Below are some of the articles from the theme page, with short quotations:
Extreme weather the achilles’ heel of the U.S. economy? (June 2011):
Everything has its price, even the weather. New research indicates that routine weather events such as rain and cooler-than-average days can add up to an annual economic impact of as much as $485 billion in the United States. The study, led by the National Center for Atmospheric Research (NCAR), found that finance, manufacturing, agriculture, and every other sector of the economy is sensitive to changes in the weather. The impacts can be felt in every state. “It’s clear that our economy isn’t weatherproof,” says NCAR economist Jeffrey Lazo, the lead author. “Even routine changes in the weather can add up to substantial impacts on the U.S. economy.” This is the first study to apply quantitative economic analysis to estimate the weather sensitivity of the entire U.S. economy.
Months left to go, 2011 becomes the costliest year for natural disasters in history (Aug. 2011):
Japan’s earthquake in March is set to make 2011 the costliest year to date for natural disasters, reinsurer Munich Re said, although the number of deaths globally is relatively low so far. Total global losses from natural disasters for the first six months alone were $265 billion, easily exceeding the $220 billion recorded for the whole of 2005, previously the most expensive year to date, the German firm said. The economic loss for the first half of 2011 was more than five times higher than the average of the past 10 years, Munich Re said, and more than double the total for 2010 of $130 billion… “It is very rare for such an extreme accumulation of natural hazard events to be encountered,” Munich Re, which is the world’s top reinsurer, said in a statement… In terms of the human cost overall, however, 2011 is relatively benign — so far. Natural disasters killed 19,380 people in the first six months, compared to 230,300 in 2010.
Scientists dismayed by unending string of disasters plaguing U.S. (Sep. 2011).
Earthquakes may make 2011 second-costliest year, Swiss Re says (Sep. 2011)
Insurance market Lloyd’s dives into red on ‘unprecedented number of catastrophes’ (Sep. 2011).
2011: A record-breaking year for natural disasters in the U.S. (Oct. 2011).
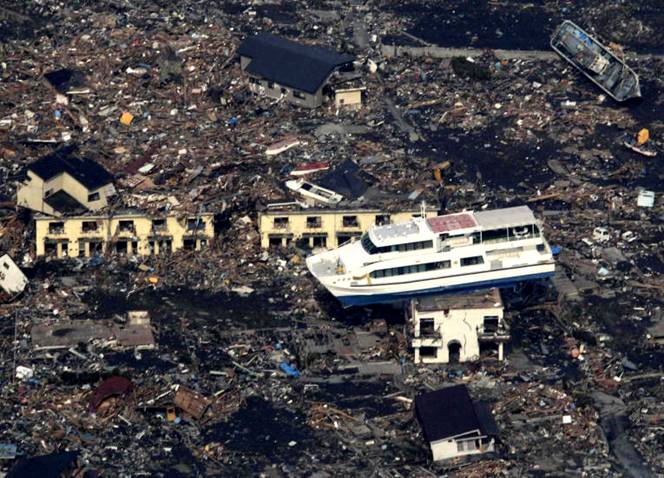
The 2011 Tohoku earthquake and tsunami event in Japan on March 11, 2011, brought a ferry to the roof top of this building in Otsuchi.
The overall cost could exceed US$300 billion, making it the most expensive natural disaster on record.
A450: Failing GPS equipment
The Earth’s increasing wobble results in increasing misinformation from GPS equipment, since this information is based on mathematical calculations of times and distances that do not take the wobble in consideration [Wiki: Global Positioning System]. In May 2009 the American Government started to spread disinformation regarding the cause that GPS equipment will start failing in 2010, blaming lack of maintenance work on the GPS satelite network.
* ZT nl 23. May 2009. Introduction to the subject.
* ZT nl 29. Mar 2009. About the nuclear submarine USS Hartford which crashed with another American ship; and about other submarine accidents the last years.
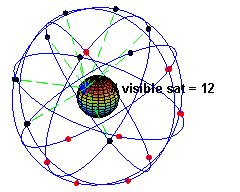
Illustration of the GPS satelite network
B) Effect of Nibiru: The Earth is warming up from within
Per the Zetas, Nibiru is the cause of a heat up of the Earth’s core. The heat moves outwards to the oceans, resulting in ocean warming, which again heats up the troposphere and the climate in several ways. The fact that the oceans are the primary influence on climate and tropospheric temperatures, not the other way around, and the fact that the Sun and changes in the atmosphere (including the products of human activity) only minimally can influence the ocean temperatures, have been elementary insights among oceanographists for several decades. Robert E. Stevenson (1921-2001), oceanographist and the father of space oceanography, wrote in 2000 the very interesting epistle Yes, the Ocean Has Warmed; No, It’s Not ‘Global Warming’.
The Zetas gave a comment in a note from before 15. July 1995, Heralding:
”Weather changes heralding the giant comet's approach will at first be within normal parameters. As long as meteorologists can find a similar pattern on the books or an old timer can be found to regale us with tales of the old days, no one will get unduly alarmed. The weather, after all, is a constant source of conversation, but the intensity of these discussions will change when the effects on food chains relied upon by man move outside of familiar boundaries. It is at this point that Alarm Bells will go off. All attempts to explain the changes based on Global Warming from the Greenhouse effect will run into snags as the weather will refuse to be predictable. Areas of the world which have been deserts throughout mankind's memory will become swamps under constant and repeated rains. Temperate climates used to periodic gentle rainfall will suffer intractable droughts. Then this will switch about, for no apparent reason. The reason lies deep within the Earth's core, an area the meteorologists refuse to consider, and thus their predictions on the atmosphere will never be based on the right parameters.
A key change, to which one could point, is the warming of the Earth's oceans, around the globe. This has been measured as a 6 inch rise, worldwide, on all the beaches. The waters have risen because they are warmer, and warm water takes up more room than cold water, as all elementary physics books will report. How is it that the oceans, so very deep and so very cold, have warmed up? Is it the almost imperceptible rise in the temperature of the air, a degree or so, as reported to date? Since heat rises, why would this slight rise affect the oceans? Meteorologists will tell you that the effect of air warming is air turbulence, not warmer oceans. The oceans are warmer because the core of the Earth has heated up, and it does so in response to its brother coming closer.”
The Zetas gave the following comment in ZT Chat 15. Oct 2011:
“Global Warming as the excuse for the Earth changes brought on by the approach of Planet X was intended to cover the effects of the roiling Earth core. Up until the 1980's a Global Cooling trend was expected, but this changed due to data observed in the late 1980's. By 1988 the trend was clear. Global Warming was being recorded. Glaciers were melting, and a perceptible increase in air and ocean temperature could be claimed. The establishment was aware that Planet X was inbound by 1983, confirmed by their own IRAS sightings via an infrared balloon sent above the clouds. Volcanic activity was on the increase, particularly undersea volcanic activity which is primarily invisible to the public. Thus, the claim that carbon emissions were causing this would serve as the cover for these Earth changes caused by Planet X, or so the establishment hoped.
Once set in motion, and with such esteemed spokespersons as Al Gore leading the charge, the establishment tweaked the data to support their claims, and until it was discovered that they used erroneous data to lie about the matter, were able to fool the public to a great extent. By then, to maintain the illusion that politicians were taking the Global Warming excuse seriously, carbon tax laws had been passed. In the world of government and greed, money collected for any reason is not given back, not returned. Once started, a trend is hard to reverse. The Global Warming excuse for rising sea levels in those regions that are sinking has also been useful for the establishment. Thus, these lies are perpetuated.”
Nancy Lieder gave an interesting summing-up in ZT nl 17. Feb 2013. She mentioned Al Gore’s newest book, The Future: Six Drivers of Global Change (2013), and pointed out how the catchword “Global Warming” now has changed to ”Climate Change”.
The climatologists Prof. Seymour Laxon and his promising star researcher Dr. Katharine Giles died within a period of four months, apparently in accidents (MailOnline). The Zetas claimed in ZT Chat 13. Apr 2013 that both had been murdered by the cover-up flock. The Zetas pointed a finger at the leading climatologist Phil Jones as the “chief fraudster” in the Global Warming swindle:
“Were these accidents? No. It was noted that the lorry driver was released and not arrested for vehicular homicide or reckless driving, so was Dr. Giles at fault? She had been drugged to become disoriented, timed so this would occur during a stretch she normally took to work, such that she veered into the lane the lorry was on, unsteady. The lorry followed behind her until there was an opportunity, an assassin at work. The British have a strong hand in the cover-up over the Global Warming fraud, a chief scientist working under the auspices of the UN being the chief fraudster, and are using murder to hide the origins of the fraud.”

Climatologist Phil Jones: The chief fraudster?
The scientific consensus is that the troposphere’s average global temperature during the last 100 years (1906-2005) has increased with 0,74 °C. The scientific quarrel is about the cause and the consequences of this very slight increase in temperature. Is the increase within the normal climatic variation, and therefore needs no further explanation? To explain the increase in temperature by an increase in solar activity has gone out of fashion in the latest decade, since the amount of irradiation from the Sun that is experienced on Earth has been record low during the last 11-year solar cycle.
The Intergovernmental Panel on Climate Change (IPCC) is fronting the dogma that increasing greenhouse gas concentrations resulting from human activity such as fossil fuel burning and deforestation have caused most of the observed temperature increase since the middle of the 20th century. The major greenhouse gases are: Water vapor, which causes about 36–70 % of the greenhouse effect; carbon dioxide (CO2), which causes 9–26 %; methane (CH4), which causes 4–9 %; and ozone (O3), which causes 3–7 %. Since it is difficult to explain water vapor as an environmental threat, IPCC has instead chosen to focus on the CO2 concentrations. As a matter of fact, an increase of CO2 just makes our world greener and more lush. The CO2 level in the pre-industrial era represented around 0,028 % of the Earth’s atmosphere. It is mainly the increase of CO2, this enhancer of lushness, from 0,028 % to today’s level of 0,038 %, that IPCC blames for the increase of the average global temperature the last hundred years (1906-2005) by 0,74 °C. The critics of the consensus view, however, claim that all the facts indicate that it is the atmospheric temperature level that determines the CO2 level, and not the other way around.
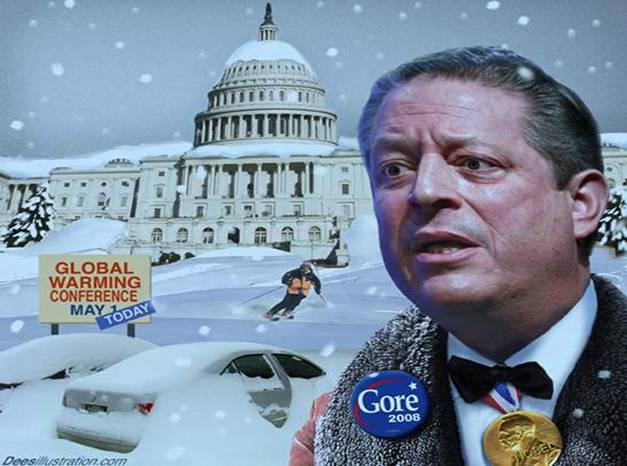
Nobel Peace Price winner Al Gore and the media debate have served as a gigantic decoy
with their primary focus on the average global temperature and the CO2 level.
Wiki: Phil Jones (climatologist); Climatic Research Unit email controversy.
For C and D,
go to this article Part II.
Back to:
* Rolf Kenneth's ZetaTalk & Nibiru Theme page // Home |